

How to Setup a Spreadsheet to Calculate Project Cost requires organizing the document around five core sections: direct costs covering materials, labor, and equipment; indirect costs covering general conditions and overhead; subcontractor costs with GC markup applied; contingency as a project-specific risk allowance; and profit margin as a separate calculated line. A spreadsheet that omits any one of these sections produces a budget that appears complete but carries a hidden financial gap that surfaces as a cost overrun during construction.
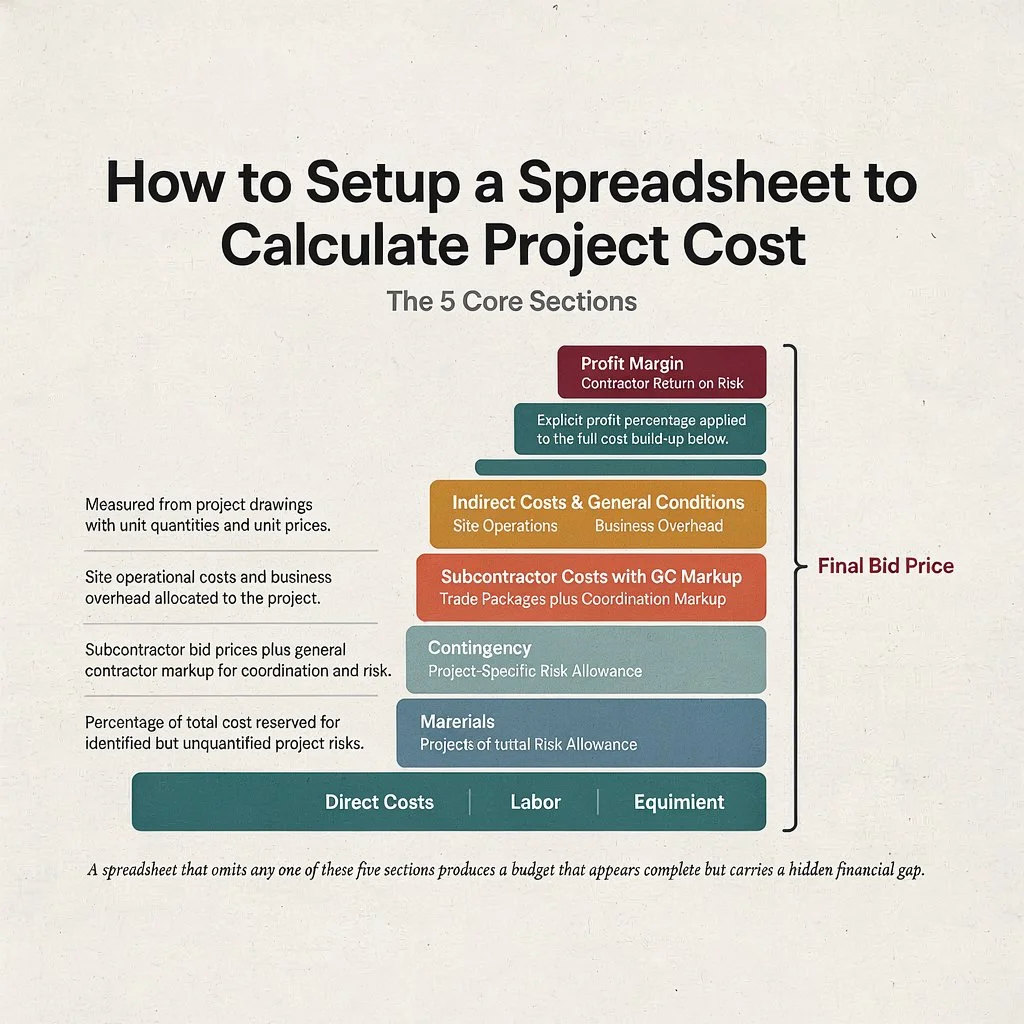
Most project cost spreadsheet errors do not happen because the contractor does not know how to use the software. They happen because the spreadsheet was set up without all the cost categories a construction project actually carries, or because the numbers entered into the spreadsheet were estimated from memory rather than measured from the project drawings. The gap between a spreadsheet that looks right and a spreadsheet that is right is the difference between a bid that wins the contract and earns the planned margin and a bid that wins the contract and loses money on execution.
Understanding how to setup a spreadsheet to calculate project cost correctly, from the category structure through the formula logic to the data entry standards, is what makes the difference between a financial management tool that protects the project and one that gives the contractor false confidence in numbers that do not reflect reality.
What Is Project Cost Management and Why Does Your Spreadsheet Structure Matter?
Project cost management in construction covers two distinct activities that both require the same spreadsheet but use it differently. Before construction begins, the spreadsheet is used as an estimating and bid preparation tool that calculates the total cost of the project from the planned scope and produces the bid price the contractor submits to the project owner. During construction, the same spreadsheet is used as a budget tracking tool that compares actual costs incurred against the planned costs estimated before the project began.
A spreadsheet that is structured correctly for both uses simultaneously serves the contractor at every stage of the project lifecycle without requiring a separate document for each purpose. A spreadsheet structured only for pre-construction estimating cannot support real-time budget tracking during construction, and a spreadsheet structured only for cost tracking does not produce the bid-ready cost summary that pre-construction estimating requires.
Our professional construction cost estimating services provide contractors with verified, trade-specific cost data that populates either spreadsheet structure with numbers accurate enough to bid from and track against throughout construction.
The Core Cost Categories Every Construction Project Spreadsheet Must Include
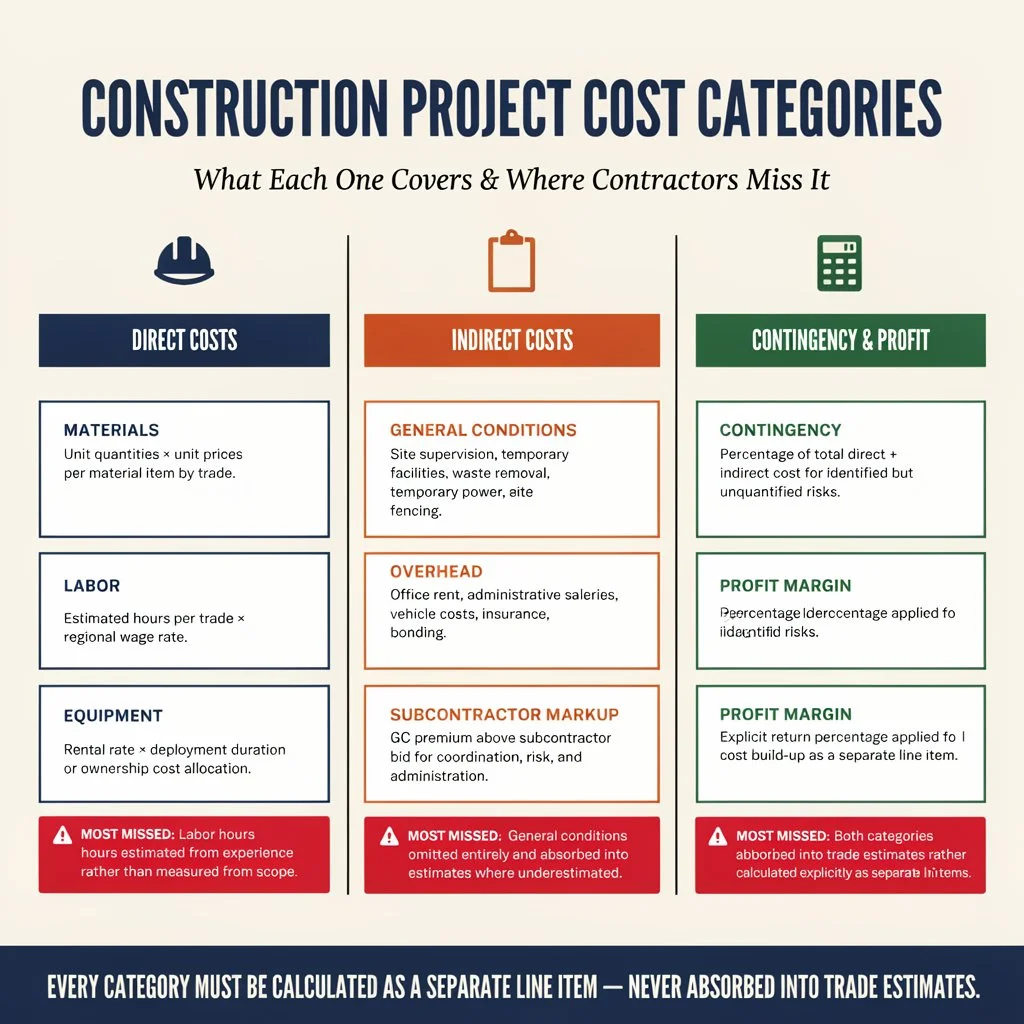
A construction project cost spreadsheet is only as complete as the cost categories it tracks. Missing a category in the spreadsheet structure produces a budget that appears complete but carries a hidden financial gap that the contractor absorbs during construction rather than recovering through the bid price.
Direct Costs: Materials, Labor, and Equipment
Direct costs are the costs that can be measured directly from the project scope and drawings and traced to specific scope items in the construction work. Material costs are entered as unit quantities multiplied by unit prices for each material item, or as a single material cost line per trade for simpler projects where detailed material breakdowns are not required.
Labor costs are entered as estimated hours per trade multiplied by the applicable wage rate for that trade in the project’s regional market. Equipment costs are entered as rental rates multiplied by estimated deployment duration for rented equipment, or as an ownership cost allocation for contractor-owned equipment deployed on the project.
Every direct cost entry in the spreadsheet must have a quantity basis, a unit, and a unit price so that changing any one of these inputs automatically updates the line item total and the section subtotal through the formula structure.
Indirect Costs: Overhead, General Conditions, and Subcontractor Markup
Indirect costs are the cost categories that support the direct construction work without being traceable to a specific scope item, and they are the most frequently omitted category in contractor-built project cost spreadsheets. General conditions cover the site operational costs that run throughout the project: site supervision, temporary facilities, waste removal, temporary power and water, construction fencing, and the management overhead of coordinating multiple trades across an active job site.
Overhead covers the business operating costs that the contractor must recover through their project pricing: office rent, administrative salaries, vehicle costs, insurance premiums, and bonding costs. Subcontractor markup is the premium above subcontractor bid prices that the general contractor applies to cover the coordination, risk assumption, and administrative overhead of managing each subcontractor’s scope.
All three of these indirect cost categories must appear as explicit spreadsheet line items with their own calculated totals rather than being embedded in trade-level estimates where they are consistently underestimated.
Contingency and Profit Margin
Contingency is a project-specific risk allowance calculated as a percentage of the total direct and indirect cost. It covers the financial impact of risks that are identified but not yet quantified at the estimating stage: material price movements between estimate and procurement, productivity variations from site conditions, and minor scope additions that arise during construction without triggering a formal change order.
Profit margin is the return on the contractor’s investment of capital, risk, and management capacity. Both contingency and profit margin must appear as separate, explicitly calculated line items in the project cost summary rather than being absorbed into trade estimates where they create accounting opacity that prevents accurate post-project financial analysis.
How to Set Up a Spreadsheet to Calculate Project Cost by Phase or Trade
The two primary organizational approaches for a construction project cost spreadsheet each serve a different management purpose. Organizing by construction phase groups costs under phase headings that align with the construction schedule: site preparation, foundation and substructure, structural framing, building envelope, MEP rough-in, interior finishes, and site work. This approach supports project schedule management and makes it easy to identify which phase is driving budget variance during construction.
Organizing by trade groups costs under trade contractor headings regardless of when in the project timeline each trade performs its work. This approach supports subcontractor bid comparison and procurement management by keeping all costs related to each trade in one location.
Most professional construction cost spreadsheets use a hybrid structure that organizes first by construction phase and then by trade within each phase, producing a document that supports schedule-aligned project management and trade-specific cost control simultaneously.
Accurately quantifying the scope of work in each phase and each trade requires measuring from project drawings rather than estimating from experience. Professional quantity takeoff services produce the verified quantities that make phase-based and trade-based cost entries reliable enough to bid from rather than directional estimates that require contingency padding to compensate for uncertainty.
The Formulas That Make a Project Cost Spreadsheet Work
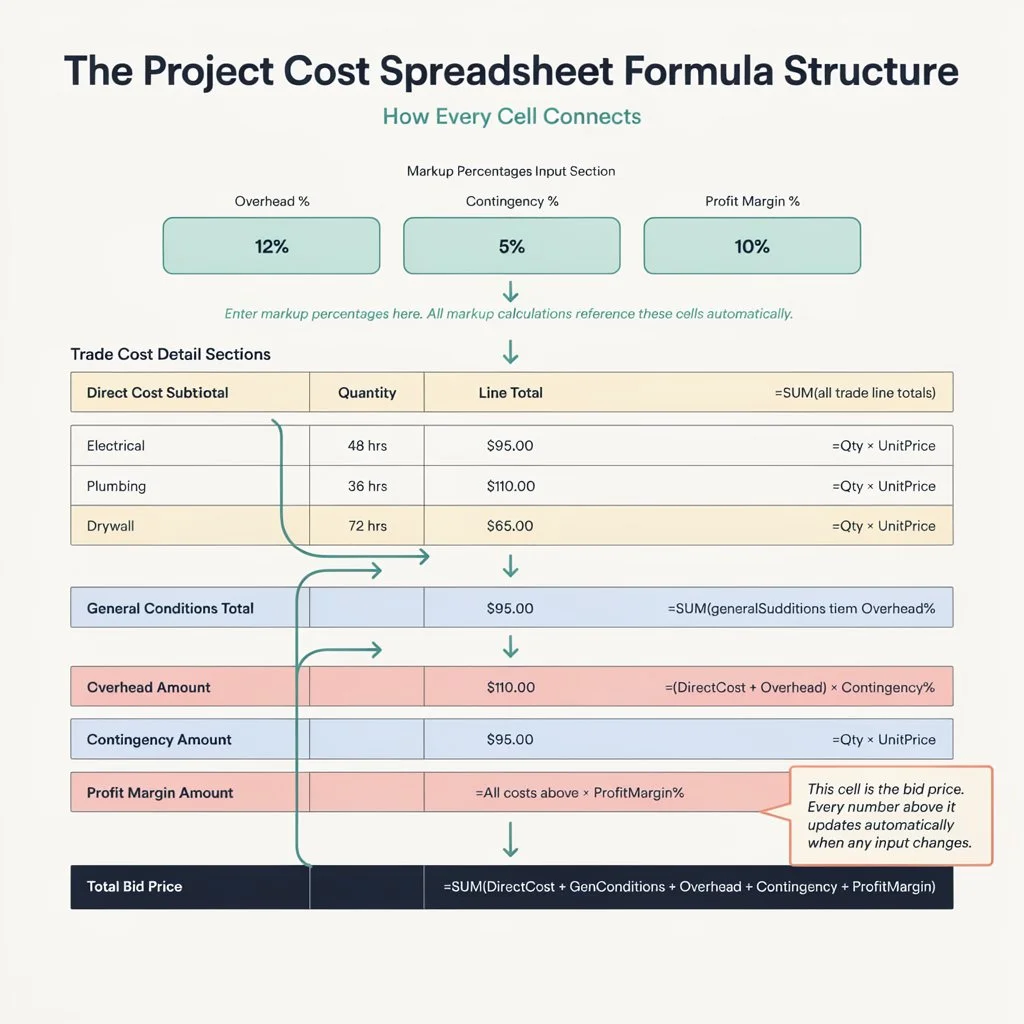
The SUM function is the foundation of every project cost spreadsheet calculation, and it must be structured to update automatically when new line items are added or existing ones are changed. The material cost subtotal for each trade is the SUM of all material unit prices multiplied by their respective quantities in that trade section. The labor cost subtotal is the SUM of all labor hours multiplied by their applicable wage rates. The direct cost total is the SUM of all trade subtotals across all phases.
Each SUM formula should reference a named range or a defined cell range rather than a static list of individual cell references, so that inserting a new row within a trade section does not require updating the section subtotal formula manually.
Percentage-based markup formulas handle the indirect cost categories. The overhead amount is calculated as the overhead percentage multiplied by the direct cost total cell reference. The contingency amount is calculated as the contingency percentage multiplied by the sum of the direct cost total and the overhead amount. The profit margin is calculated as the profit percentage multiplied by the sum of all costs above it in the build-up.
The final bid price cell is the SUM of the direct cost total, the overhead amount, the general conditions total, the subcontractor cost total with markup applied, the contingency amount, and the profit margin amount. Every percentage in this formula structure should be entered in a dedicated input cell at the top of the spreadsheet so that changing a markup percentage updates the entire cost build-up without requiring formula edits.
How to Structure Your Project Cost Summary Section
The project cost summary section is the top-level view of the spreadsheet that presents the total cost for each major category without the line-item detail that makes the body of the spreadsheet too dense to communicate quickly to a client or lender. The summary shows total material cost, total labor cost, total equipment cost, total subcontractor costs with markup, total general conditions, overhead, contingency, and profit margin as a clean vertical cost build-up that any client can review without requiring access to the full detailed sections.
Every cell in the project cost summary section should contain a formula that links to the corresponding subtotal in the detailed section of the spreadsheet rather than a manually entered number. This linking structure ensures that changes made to any line item in the detailed sections automatically propagate to the summary without manual recalculation.
A well-structured summary section also includes a column showing each category as a percentage of the total bid price, which gives the contractor and the project owner a proportional view of where the project cost is concentrated, supporting value engineering discussions when the initial bid price exceeds the available budget.
Working with budget estimating services that produce trade-specific cost breakdowns compatible with standard spreadsheet cost summary structures gives contractors a professional data source that populates every summary category with verified, market-calibrated figures rather than manual estimates.
How to Track a Project Budget With Your Spreadsheet During Construction
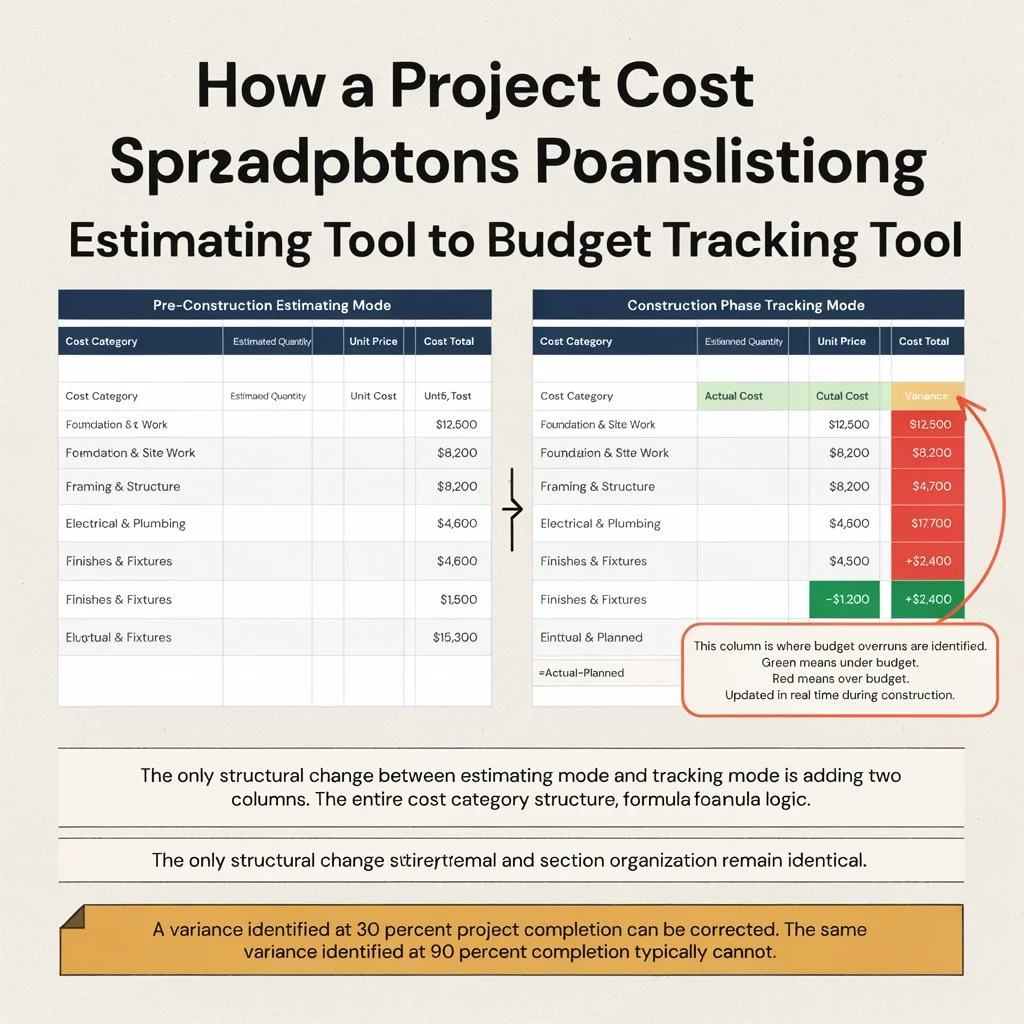
The project cost spreadsheet transitions from a pre-construction estimating tool to a construction phase tracking tool by adding an actual cost column alongside the planned cost column for each line item. The difference between the planned and actual cost in each row is the cost variance, and a variance column calculated automatically as actual minus planned gives the project manager a real-time view of where the project is tracking against the original budget at the line item level.
The practical update process during construction covers three data streams: actual material costs updated as purchase orders are confirmed and invoices received from suppliers, actual labor costs updated as weekly payroll is processed and hours are allocated to the project, and actual subcontractor costs updated as progress invoices are approved and recorded against each subcontractor’s contract value.
A project cost spreadsheet updated in real time during construction gives the project manager the earliest possible warning of budget variance while there is still time to take corrective action. A variance identified at 30 percent project completion can typically be addressed through scope adjustments, procurement negotiations, or crew productivity improvements. The same variance identified at 90 percent completion leaves few options beyond absorbing the cost.
Common Project Cost Spreadsheet Mistakes That Produce Budget Overruns
The most financially damaging spreadsheet structure mistakes all share the same characteristic: they produce a budget total that looks complete but is systematically missing cost that the project will actually incur. Omitting general conditions as a separate cost category and distributing site operational costs across trade estimates is the most common structural error, because trade estimators consistently underestimate the general conditions burden when it is not tracked separately.
Applying a single overhead percentage to the total project cost rather than calculating overhead from the contractor’s actual business cost structure is the second most damaging structural mistake, because a percentage chosen from industry averages without verification against the contractor’s own books consistently understates or overstates the real overhead burden.
The most damaging data entry mistakes involve entering material quantities from memory or from previous project experience without measuring from the current project’s drawings. Each project has a different scope, a different framing configuration, a different specification grade, and a different site condition profile, and a quantity estimate that worked on a previous project produces a cost calculation that may be significantly wrong on the current one.
Project Cost Spreadsheet vs Professional Construction Estimate: What Is the Difference?
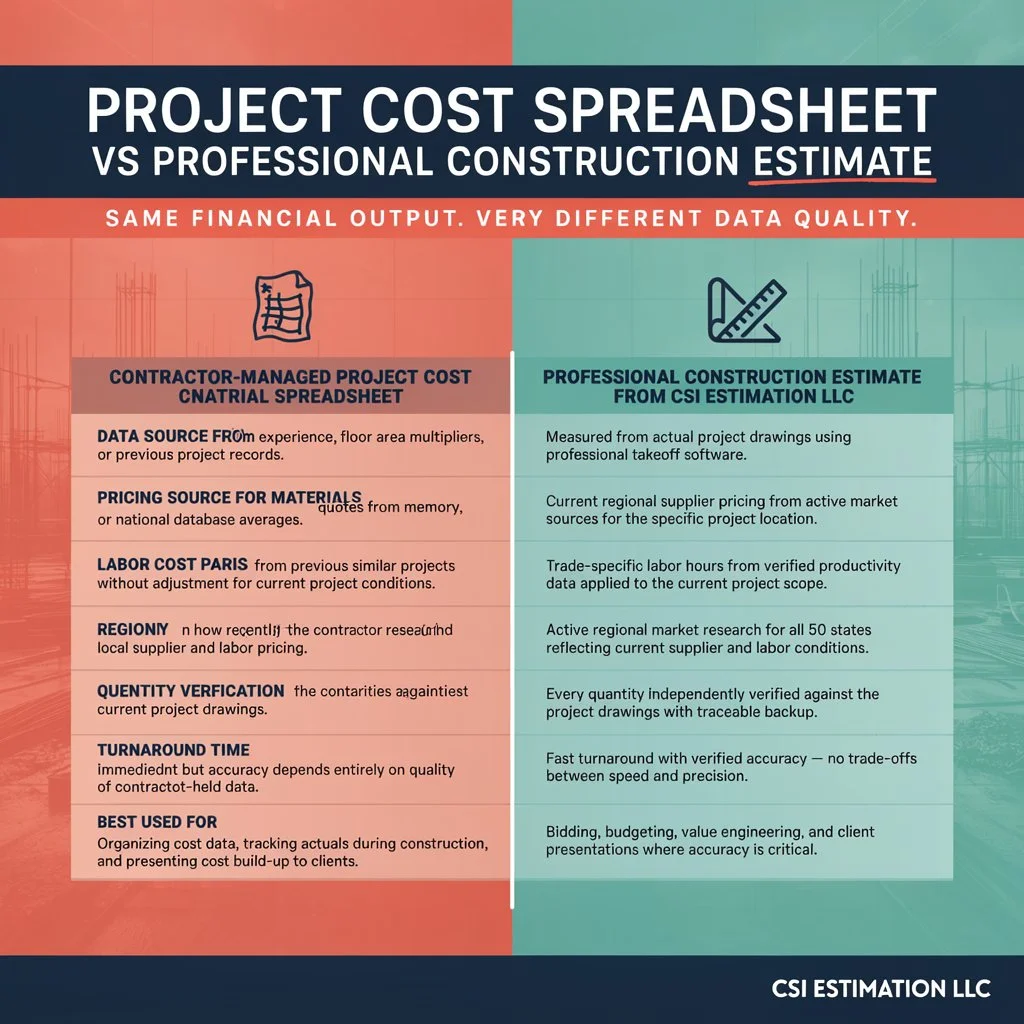
A well-structured project cost spreadsheet provides exactly what it is designed for: a financial framework that organizes cost estimates into a consistent structure, calculates totals and markups automatically, and presents the project cost build-up in a format that clients and project owners can review and approve. These are genuine capabilities that make a spreadsheet a valuable financial management tool for any contractor who sets one up correctly.
What a contractor-managed project cost spreadsheet cannot produce is the verified cost data that makes the numbers in each cell accurate rather than estimated. Verified material quantities require measurement from the actual project drawings using professional takeoff methodology, not estimation from floor area or experience. Current regional market pricing requires active research into local supplier pricing and labor rates, not national database figures applied without adjustment for regional conditions.
When contractors outsource their construction estimating to a professional firm, they receive trade-specific cost data that populates every line of their project cost spreadsheet with numbers drawn from verified quantities and current market pricing rather than assumptions, which is what makes the spreadsheet reliable enough to bid from and financially safe enough to build from.
How CSI Estimation LLC Delivers the Cost Data Your Spreadsheet Needs
CSI Estimation LLC produces verified, trade-specific construction cost data for contractors across all 50 states, organized by CSI MasterFormat division in a format that maps directly to standard project cost spreadsheet structures. Their estimating team measures material quantities from project drawings using professional takeoff software, applies current regional labor rates and material pricing from active market sources, and delivers trade-specific cost breakdowns that contractors enter directly into their project cost spreadsheet categories without additional research or adjustment.
Our professional material takeoff services replace the manually estimated material quantities that represent the single largest source of spreadsheet inaccuracy for most contractors, producing drawing-verified quantity data for every material category in the project scope with turnaround times of 24 to 48 hours for most standard residential projects and 3 to 5 business days for commercial projects.
Submit Your Project Drawings and Get Verified Cost Data Today
A well-structured project cost spreadsheet gives every contractor the financial management framework they need to bid competitively and track costs accurately throughout construction. The framework only works when the numbers entered into it are accurate, and accurate numbers come from verified quantities and current market pricing rather than estimates entered from experience.
Submit your project drawings to CSI Estimation LLC today and receive trade-specific, drawing-verified cost data organized by CSI division and ready to populate every line of your project cost spreadsheet, delivered within 24 to 48 hours for most standard project types.
Contact CSI Estimation LLC today and take the first step toward a project cost spreadsheet built on numbers you can bid from and build from with confidence.